

Last month we suggested a busier spring might not mean a stronger one. So far, that’s how it’s playing out: the recovery is still some way off.
According to the September QV House Price Index, national residential property values fell 1.5% over the three months to the end of September. That’s an improvement on August’s 1.9% quarterly decline, but hardly the turnaround many had hoped for.
The average New Zealand home is now worth $892,580 – down 1.9% since the beginning of the year and 0.9% lower than this time last year.
What’s keeping the market on hold?
New Zealand’s property market isn’t short of buyers. But it is short of urgency.
With plenty of homes available and little immediate pressure to commit, purchasers can afford to be selective. For vendors, that often means longer selling periods, more negotiation and increasingly realistic price expectations.
But supply is only part of the equation.
QV points to a combination of economic uncertainty, employment confidence and borrowing costs as factors weighing on the market. The approaching general election is adding to that caution, particularly among property investors.
It’s creating something of a stalemate. Sellers are waiting for conditions to improve, while buyers see little reason to rush.
And although the pace of national price declines has moderated, QV suggests it will take more than seasonal activity to shift the market out of its current holding pattern.
Where the market is moving, and where it isn’t.
National averages are useful indicators, but they can hide as much as they reveal.
Take September’s results.
Queenstown recorded quarterly growth of 3.1%. At the other end of the spectrum, Wellington and Whangārei both fell 3%.
That’s a gap of more than six percentage points between markets over the same three months.
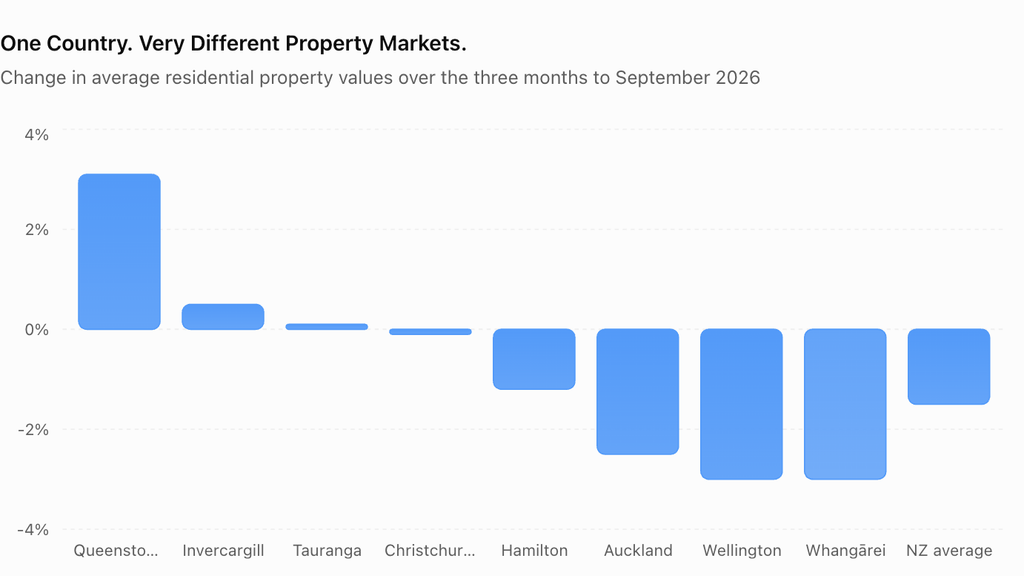
Source: QV House Price Index, September 2026. Percentage changes represent the three months to 30 September 2026.
The contrast extends beyond individual cities.
Otago recorded 1.9% quarterly growth, while Southland’s average home value is now 4.3% higher than at the beginning of the year. Canterbury has also demonstrated greater resilience, with Christchurch values almost unchanged over the September quarter.
These differences reflect more than just property prices. Local employment conditions, economic activity, housing supply and buyer demand are all influencing how individual markets perform.
What does this mean for property-backed investors?
September’s figures show that the wider market doesn’t tell you everything about the quality of an individual investment.
When markets can move this far apart in a single quarter, concentration in one market is a risk in itself. Norfolk’s portfolio is spread across borrowers, property types and regions, so no single local market carries the weight of the whole.
Each lending opportunity is assessed on its own merits: the underlying property security, the borrower’s ability to meet their obligations, and how the loan will be repaid.
Rather than relying on capital appreciation, Norfolk generates investor income from the interest borrowers pay on loans secured by first registered mortgages over New Zealand property.
What happens next?
The next few months may bring greater clarity. The election will pass, seasonal activity may increase and buyer confidence could gradually improve. But the timing and strength of any recovery remain uncertain.
Norfolk’s approach doesn’t depend on that answer. It has paid monthly income distributions through 20 years of changing property conditions.
Norfolk’s annualised pre-tax return for the month ending 30 September 2026 was 6.25% p.a. Returns are not guaranteed, past performance is not a reliable indicator of future returns, and your capital is at risk.*
National figures show where the market has been. Careful lending decisions are what matter for what comes next.
Learn More
If you’re looking for regular monthly income from a diversified portfolio of loans secured by first registered mortgages over New Zealand property, Norfolk Mortgage Trust offers a long-established investment approach focused on disciplined lending and consistency through changing market conditions.
To learn more, download our Product Disclosure Statement or Investment Guide at norfolktrust.co.nz.
*The 6.25% annualised pre-tax return is as at 30th September 2026, is calculated monthly and is subject to change without notice. Past performance is not a reliable indicator of future performance. All investments carry risk.
Data Source: QV House Price Index, Sept 2026